Presidential performance / Energy

What was produced—and what access was secured?

Compare U.S. energy production across equal presidential windows, then examine actual crude imports and separately documented overseas rights.

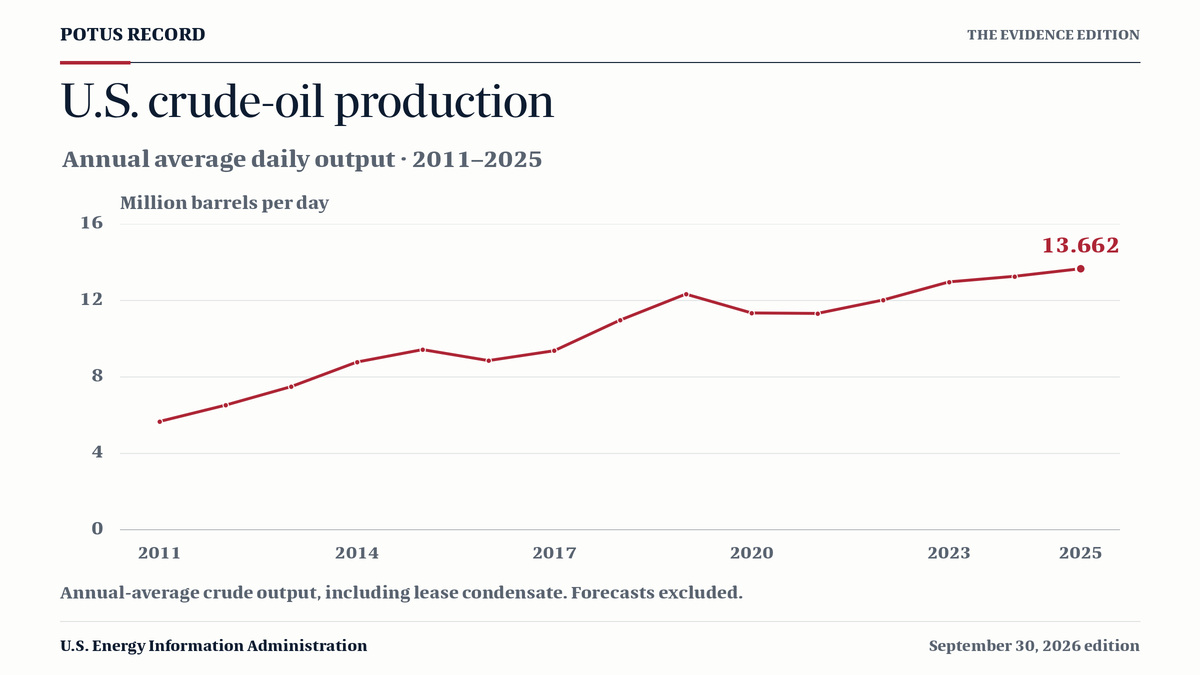
Line chart of U.S. crude-oil production from 2011 through 2025, in million barrels per day. Production reaches 13.662 million barrels per day in 2025.

Annual-average U.S. crude-oil production, including lease condensate. Historical estimates and revisions are retained; forecasts are excluded.

01 / PRODUCED IN THE UNITED STATES

Production has a history.
Show the starting point.

2025 set annual records for U.S. total energy, crude oil and dry natural gas production. Compare the level and the change separately; neither isolates a president’s policy effect.

Total energy · 2025107.163quadrillion Btu
Crude oil · 202513.662million barrels / day
Dry natural gas · 202539.288trillion cubic feet / year
2025–2025 / million barrels / day

Donald Trump II

13.662+3.0% from 2024
Crude oil for Donald Trump II. million barrels / day. Shaded bars precede the window. Blank future years are unpublished. Exact observations are in the annual table.0.03.87.511.315.02023: 12.9722024: 13.2672025: 13.662202320242025
Shading: inherited contextCommon scale across administrations

Annual observations, through 2025. Calendar windows include January days before inauguration. The latest annual value can be revised; 2026 forecasts are excluded.

Same first 1 year

Change from the inherited level

Endpoint ÷ preceding year − 1. Chronological order; no overall presidential score.

Read exact annual observations and inherited context
Donald Trump II: Crude oil (million barrels / day)
YearRolePublished level
2023Inherited context12.972000
2024Inherited context13.267000
2025In window13.662000
02 / ACTUAL CROSS-BORDER FLOWS

Oil arriving is a measured flow.

2025 annual observations. Selected origins below are not the whole import distribution. Imports reflect commercial flows, refinery needs and policy; more imports are not automatically a better outcome.

Canada3.910 million b/d
Mexico0.383 million b/d
Saudi Arabia0.269 million b/d
Venezuela0.140 million b/d
Imports minus exports · 2025-2.848

million b/d · crude oil + petroleum products

2.207

million b/d · crude oil only

Negative = net exports. Positive = net imports. Petroleum net exports can coexist with crude oil net imports.

Blank source cells remain “Unavailable,” not zero. If the selected production window is incomplete, this section shows the latest complete year, 2025. These observations do not establish deliveries under the August 2026 Venezuela agreement.

03 / OVERSEAS ACCESS & PURCHASE RIGHTS

A right secured.
An outcome still to measure.

Official agreement announcement

The White House’s August 31, 2026 fact sheet describes U.S. equity and purchasing rights tied to NABEP operations in Venezuela. These are different rights with different denominators.

OWNERSHIP35%

Corporate-parent equity

The announced U.S. government stake in NABEP’s corporate parent. It is not 35% of all Venezuelan oil, national reserves or production.

OFFTAKE20%

Purchase at production cost

The announced right to buy 20% of output from NABEP’s current and future fields at production cost. This is a purchase right, not free delivered oil.

PRIORITY80%

First refusal on the remainder

A right of first refusal to purchase the remaining production. A priority purchase right does not establish that the entire volume was bought or imported.

17fields
100years of concessions
≈65bnbarrels of stated proven reserves

Figures reported by the White House. Reserves are a stock in the ground, not an annual production flow. The stated board-appointment veto and U.S.-citizen board majority concern governance; they are separate from the 35% equity stake.

Rights announced

The White House publishes the equity, purchasing and governance terms. Its fact sheet does not supply the full signed contract or audited proceeds.

Company agreements reported

DOE reports follow-up agreements involving Chevron, Eni and GE Vernova. Announced investment and future production goals remain separate from achieved output.

Outcome verification

Deliveries and returns

Actual production, deliveries to the United States and realized U.S. government returns require their own dated evidence. Equity, purchase rights and reserve estimates are never added together.

Selected documented case, not an exhaustive historical inventory of overseas agreements. Coverage gaps do not mean other administrations secured no rights. There is no comparable all-presidency rights total in this edition.

Read the Venezuela event and its evidence ↗
Official sourceWhite House: U.S.–Venezuela oil agreement (opens in a new tab)August 31, 2026 · NABEP corporate-parent equity, offtake rights, board governance and announced concessions. Government fact sheet; not the full contract or audited financial results.
Official sourceDepartment of Energy: subsequent company agreements (opens in a new tab)September 2, 2026 · DOE reports company agreement signings and future investment and production plans. Signing is distinct from completed delivery.

Read the measure correctly.

EIA annual observations, not forecasts. Total primary energy uses quadrillion Btu; crude includes lease condensate; dry gas excludes extracted natural gas plant liquids. Estimates and historical revisions remain part of the frozen publication. No composite energy ranking is calculated.

Official sourceEIA: energy production and trade (opens in a new tab)September 2026 tables · retrieved October 1, 2026 · MER Table 1.2 and EIA petroleum/natural-gas annual tables. Frozen annual observations 1975–2025, with estimates and revisions; contractual rights are presented separately.
Official sourceEIA MER Table 1.2: total primary energy production (opens in a new tab)September 29, 2026 · retrieved October 1, 2026 · quadrillion Btu; annual observations. Current source edition; estimates and historical revisions may change.
Official sourceU.S. Field Production of Crude Oil (Thousand Barrels per Day) (opens in a new tab)September 30, 2026 · retrieved October 1, 2026 · thousand barrels per day; annual observations. Current source edition; estimates and historical revisions may change.
Official sourceU.S. Dry Natural Gas Production (Million Cubic Feet) (opens in a new tab)September 30, 2026 · retrieved October 1, 2026 · million cubic feet; annual observations. Current source edition; estimates and historical revisions may change.
Official sourceU.S. Net Imports of Crude Oil and Petroleum Products (Thousand Barrels per Day) (opens in a new tab)September 30, 2026 · retrieved October 1, 2026 · thousand barrels per day; annual observations. Current source edition; estimates and historical revisions may change.
Official sourceU.S. Net Imports of Crude Oil (Thousand Barrels per Day) (opens in a new tab)September 30, 2026 · retrieved October 1, 2026 · thousand barrels per day; annual observations. Current source edition; estimates and historical revisions may change.
Official sourceU.S. Imports from Venezuela of Crude Oil (Thousand Barrels per Day) (opens in a new tab)September 30, 2026 · retrieved October 1, 2026 · thousand barrels per day; annual observations. Current source edition; estimates and historical revisions may change.
Official sourceU.S. Imports from Canada of Crude Oil (Thousand Barrels per Day) (opens in a new tab)September 30, 2026 · retrieved October 1, 2026 · thousand barrels per day; annual observations. Current source edition; estimates and historical revisions may change.
Official sourceU.S. Imports from Mexico of Crude Oil (Thousand Barrels per Day) (opens in a new tab)September 30, 2026 · retrieved October 1, 2026 · thousand barrels per day; annual observations. Current source edition; estimates and historical revisions may change.
Official sourceU.S. Imports from Saudi Arabia of Crude Oil (Thousand Barrels per Day) (opens in a new tab)September 30, 2026 · retrieved October 1, 2026 · thousand barrels per day; annual observations. Current source edition; estimates and historical revisions may change.