
Presidential performance / Trade
What crossed the border—and how did the balance change?
Compare annual exports, imports and trade balances across presidential windows, with goods, services and the size of the economy in view.
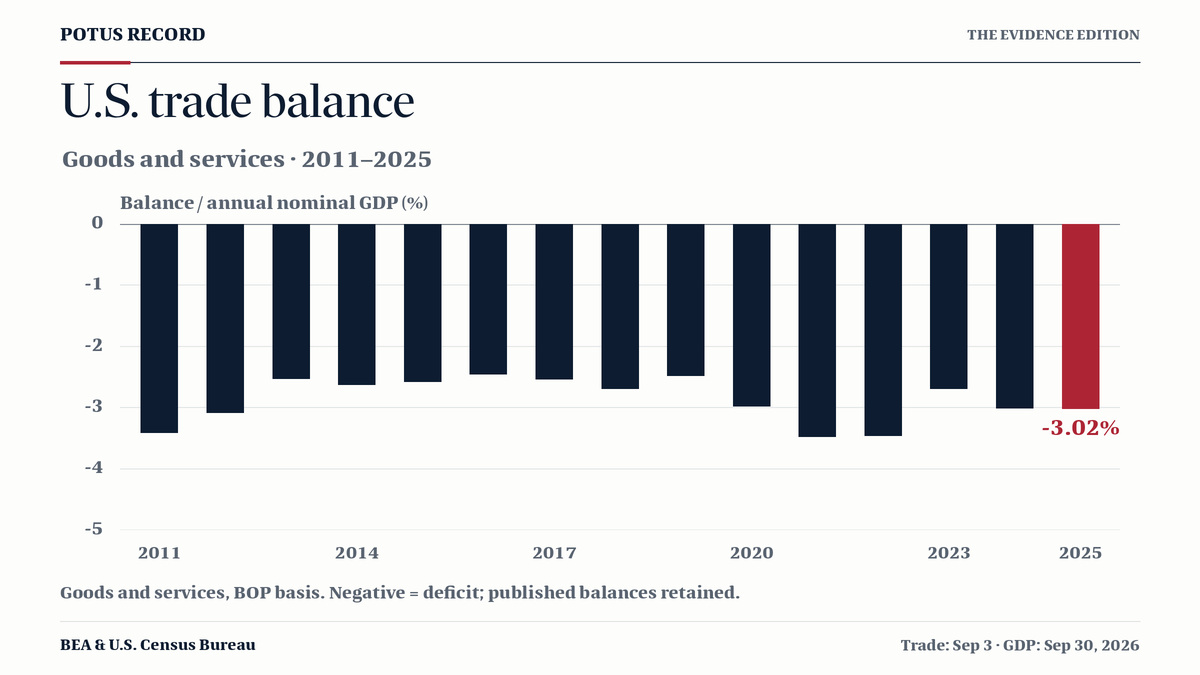
Annual goods-and-services trade balance on a balance-of-payments basis, divided by annual nominal GDP. Negative values indicate a deficit.
Donald Trump II
20251 of 1 annual observation available
Exports & imports.
Exports are U.S. sales abroad. Imports are U.S. purchases from abroad. Both use the same positive scale.
2025 · latest observed year in this window
The trade balance.
The difference between annual exports and imports. Positive is a surplus; negative is a deficit.
2025 · goods & services
A shared scale across decades. GDP shares compare trade with the size of the U.S. economy. Current-dollar amounts are not adjusted for inflation. A GDP share is not trade’s contribution to GDP growth.
Observed during a presidency. Exchange rates, demand, business decisions, inherited policy and global events all affect trade. A surplus or deficit alone is not a score of economic benefit or presidential performance.
Same duration.
A common comparison.
The year before the window is the baseline. Change compares that annual value with the final year of the selected duration. Preceding years are context, not part of the window.
2024: −3.014% to 2025: −3.020%
The list remains in chronological order. Bars show a signed change, not a ranking. A balance change is a difference in GDP percentage points, never a percentage growth rate. Unpublished years and incomplete comparisons are not estimated.
Exact annual values, definitions & sources
Annual trade on a balance-of-payments basis, in billions of current U.S. dollars. GDP shares use the same year’s nominal GDP: annual trade ÷ annual GDP × 100. Calculations use source values before display rounding. This is an annual record through 2025; later years are not forecasts.
Each window starts in the inauguration calendar year, including the January handover, and uses the first one, two, three or four calendar years. The change baseline is the preceding calendar year. Two preceding years are retained in the table even when chart context is hidden.
| Year | Exports $bn | Imports $bn | Balance $bn | Nominal GDP $bn | Exports % GDP | Imports % GDP | Balance % GDP | Notes |
|---|---|---|---|---|---|---|---|---|
| 2023Preceding context | 3,097.612 | 3,847.205 | -749.593 | 27,825.886 | 11.132 | 13.826 | -2.694 | — |
| 2024Change baseline | 3,236.406 | 4,121.877 | -885.471 | 29,380.991 | 11.015 | 14.029 | -3.014 | — |
| 2025Year 1 | 3,429.813 | 4,361.773 | -931.960 | 30,861.292 | 11.114 | 14.133 | -3.020 | — |
- All trade years come from the September 3, 2026 historical workbook. Do not splice in older Census summary-table values.
- Figures are current-dollar annual observations, not inflation-adjusted quantities or forecasts. The latest available completed year is 2025.
- Balance equals exports minus imports conceptually. Published rounded balances can differ from subtraction of the displayed rounded flows by up to $2 million in this edition; they are retained without correction.
- Annual GDP is a separately dated BEA series. Trade/GDP is a scale comparison, not the NIPA net-export component or a contribution to GDP growth.
BEA and Census: historical trade table (XLSX) — opens in a new tab ↗September 3, 2026 edition · retrieved October 1, 2026 · Table 1, annual rows. Goods on a balance-of-payments basis; services and total. Values in millions of current U.S. dollars. Published balances and rounding are preserved.
BEA and Census: July 2026 trade release and methods — opens in a new tab ↗September 3, 2026 · Explanatory notes: BOP adjustments, services coverage, revisions, seasonal adjustment and treatment of nonmonetary gold. Annual data through 2025 are selected from the accompanying historical workbook.
BEA: annual current-dollar GDP, via the Federal Reserve Bank of St. Louis — opens in a new tab ↗September 30, 2026 update · retrieved October 1, 2026 · GDPA / BEA A191RC; annual, not seasonally adjusted, billions of dollars. Separate publication vintage from the trade data; used only as an annual size-of-economy denominator.
Read the measure correctly.
Frozen September 3, 2026 BEA/Census historical table. Goods and services use the balance-of-payments basis; current dollars are not inflation-adjusted. GDP shares use each year’s nominal GDP from the separately dated September 30 BEA series. Published balances and rounding are retained; there is no overall presidential ranking.