An independent presidential recordReviewed October 1, 2026
POTUSRECORDThe office changes. The record remains.
Presidential performance / Poverty
How did poverty change?
Follow the long-term record of income poverty—and the broader picture after taxes, support and essential costs.
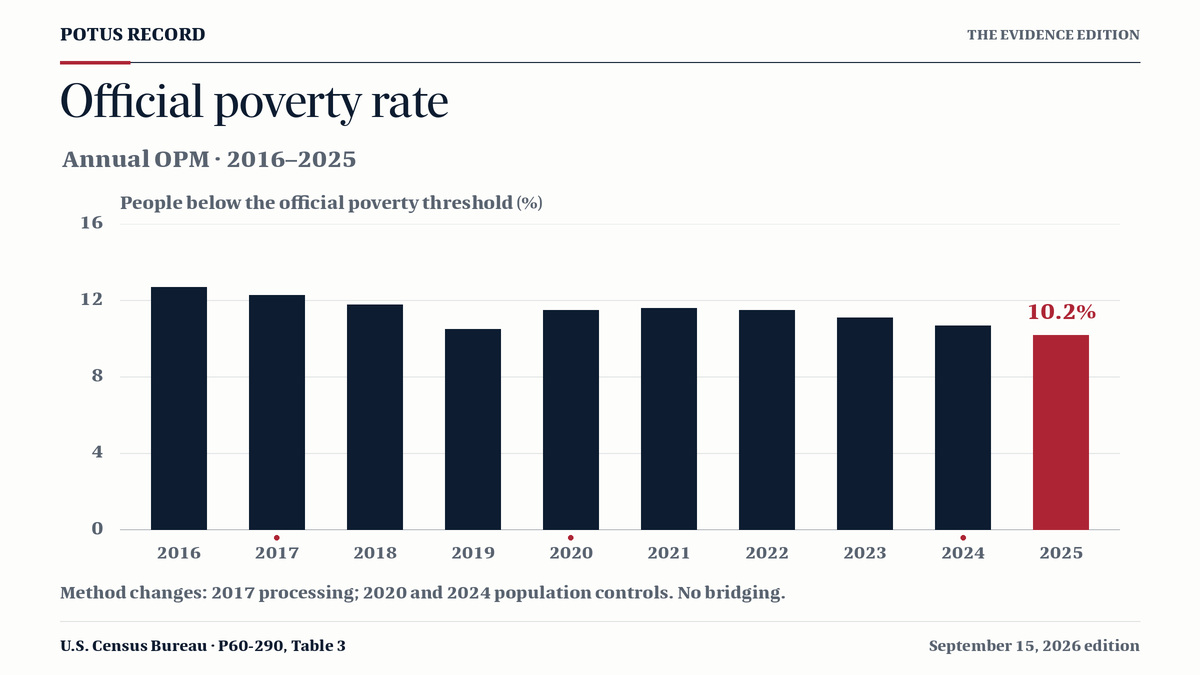
Official poverty measure based on pretax money income. Survey, processing and population-control changes qualify comparisons; published values are retained.
Census Bureau / CPS ASECCalendar 2025 · published September 15, 2026
Donald Trump II
1 of 4 annual outcomes published · incomplete
Baseline: 2024 Viewing: 2025 · year 1
01 / Official poverty measure
The long-term record.
Pretax money income against the official poverty thresholds.
10.2%
−0.5 ppnumerical change from 2024
Statistically significant decline.34.5 million people below this measure’s threshold in 2025.Census comparison with 2024 · 90% confidence.
Shading: inherited contextAnnual values · 0–20%
02 / Supplemental poverty measure
The broader picture.
Resources after taxes and support, less medical, work and other necessary expenses.
13.1%
+0.1 ppnumerical change from 2024
No statistically significant change.44.4 million people below this measure’s threshold in 2025.Census comparison with 2024 · 90% confidence.
Shading: inherited contextAnnual values · 0–20%
Read the year, not the release date. These are annual outcomes through 2025, published in 2026. Later annual results remain unavailable.
Changes during a presidency are not isolated presidential effects. Inherited conditions, Congress, state policies and other events also shape the record.
Comparability notes for this window (5)
2024: Implementation of Vintage 2025 population controls.
SPM 2019–2024 estimates use corrected BLS thresholds released July 17, 2026, as republished in P60-290.
Beginning with the 2020 survey, covering calendar year 2019, Census research identifies nonresponse bias. Official estimates are retained without an inferred adjustment.
Partial window: one calendar year is published. Do not rank this observation against completed four-year windows.
Historical endpoint differences are descriptive; statistical significance has not been tested. Changes during a presidency do not establish presidential causation.
Equal windows / Official measure
Twelve windows. The same four years.
Each preceding calendar-year baseline compared with year four. Chronological order, without a performance ranking.
Values: baseline → endpoint. Change is in percentage points, not percent. Historical survey, processing and population-control changes remain attached to their years. Numerical differences are not automatically statistically significant. Select any window to inspect its annual path and notes.
Trump II remains a separate, incomplete window.
2024 → 2025 · 10.7% → 10.2% · −0.5 pp
How to read the measures
Two definitions. Two views of hardship.
Official measure · the long historical view
Uses pretax money income, including cash benefits such as Social Security. Tax credits and noncash benefits are not counted. Published estimates extend back to 1959; this explorer starts with the 1975 context observation.
Supplemental measure · a broader resource test
Includes tax credits and eligible noncash benefits, subtracts necessary expenses and accounts for geographic housing costs. Resource-sharing units and the population universe differ from OPM. Published estimates start in 2009.
Keep the comparison aligned
These panels show OPM and SPM separately. Their difference is not a policy effect. A direct comparison requires Census Official+ to align the population universe. We do not substitute Official+ into the long OPM record.
Annual values, source versions & comparability
Census P60-290, Tables 3 and 8; published September 15, 2026. Frozen edition retrieved October 1, 2026. Change = selected annual rate − the selected window’s fixed baseline rate from the calendar year before that window. Calendar years include the January handover and are not exact inauguration-to-inauguration periods. Straight segments connect annual observations; they do not estimate monthly poverty.
The canonical series uses the updated questionnaire for 2013 and updated processing for 2017, plus revised SPM methods for 2019. Both versions remain in the source-row download. Lines break at these dual-version boundaries; changes across them are descriptive, not fully harmonized comparisons. The 2024 observations use this report’s population controls, and SPM history includes the 2026 threshold revisions.
SPM before 2009 is unavailable. In particular, Obama I has no 2008 SPM baseline, so no SPM change from that baseline is calculated. Table 3 supplies no OPM margin of error; the site does not borrow one from Official+. SPM margins below are 90% margins in percentage points, not a test of change between two years.
Donald Trump II · annual observations with inherited context
Year
OPM
SPM
SPM margin
Notes
2023Before window
11.1%
12.7%
±0.3 pp
SPM 2019–2024 estimates use corrected BLS thresholds released July 17, 2026, as republished in P60-290.
2024Baseline
10.7%
13.0%
±0.3 pp
2024: Implementation of Vintage 2025 population controls. SPM 2019–2024 estimates use corrected BLS thresholds released July 17, 2026, as republished in P60-290.
2025
10.2%
13.1%
±0.3 pp
—
Read the measure correctly.
Frozen Census P60-290 edition, published September 15, 2026; outcomes through calendar year 2025. Percentage-point change is endpoint minus baseline. Current-term results remain separate. Survey, processing, population-control and SPM-method changes qualify the historical comparisons.
Official sourceCensus Table 9: Official+ poverty history (XLSX) ↗ (opens in a new tab)P60-290 · September 2026 edition · Official+ aligns the population universe for a direct comparison with SPM. The headline OPM series is not Official+, and its difference from SPM is not a policy effect.
Official sourceCensus: CPS ASEC historical poverty footnotes ↗ (opens in a new tab)Retrieved October 1, 2026 · Survey redesign, processing changes and population controls qualify comparisons. Source flags are preserved, including the 2013 survey and 2017 processing changes.