
Presidential performance / Jobs
How did the labor market change?
Trace unemployment and labor force participation before and during each presidential window using official BLS monthly data.
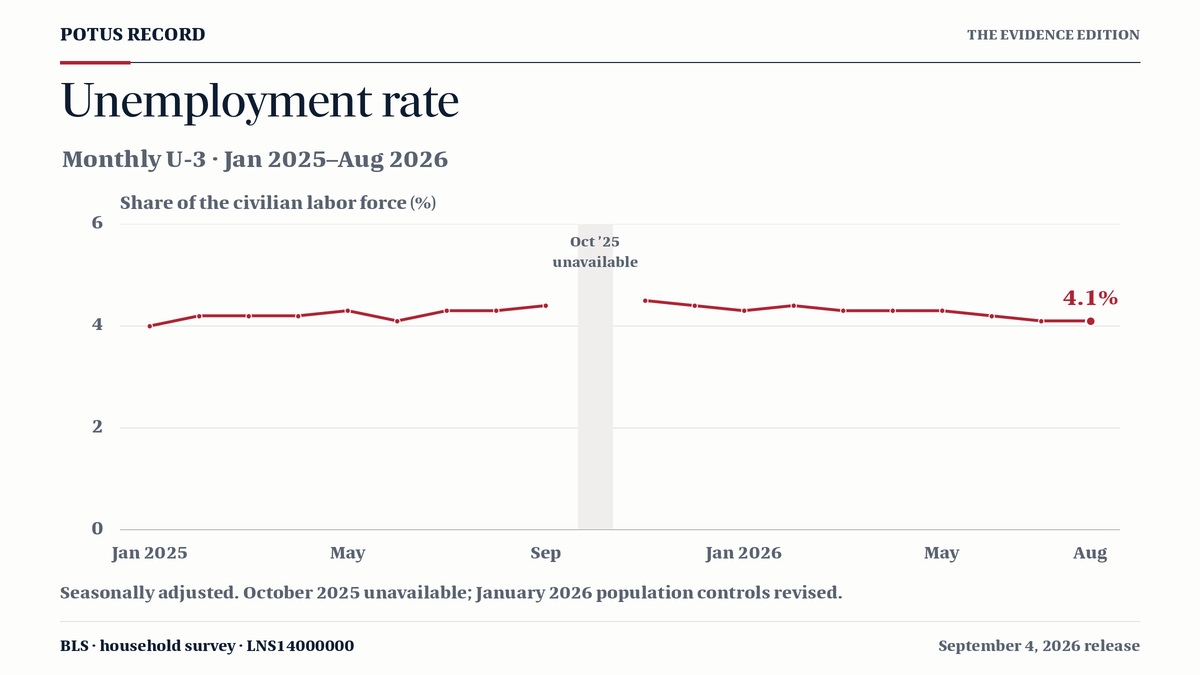
Seasonally adjusted unemployment rate. October 2025 is unavailable; January 2026 incorporates revised population controls.
Read unemployment together with labor force participation.
Compare the same 48-month windows and inspect the inherited trend. Changes are percentage points. The current term is incomplete, and these observations do not establish a president’s causal effect.
Donald Trump II20 months elapsed · incomplete window
Baseline: Dec 2024
Viewing: Aug 2026 · month 20
How high is unemployment?
4.1%
0.0 pp since Dec 2024 · share of the labor force
Months from baseline · dashed line = baseline rate
How many are in the labor force?
61.6%
-0.9 pp since Dec 2024 · share of the civilian noninstitutional population age 16+
Months from baseline · dashed line = baseline rate
The unemployment rate measures unemployed people as a share of the labor force. Participation measures the labor force as a share of the civilian noninstitutional population age 16+. Leaving the labor force can reduce unemployment without adding a job. Participation also reflects aging, education and other factors; it is context, not a presidential score.
October 2025 has no published value because of the lapse in federal appropriations. The line breaks at that month; no value is estimated. Months after Aug 2026 are beyond this edition’s data.
Published rates retain BLS revisions and population-control changes, including revised January 2026 controls. They are not a constant-population reconstruction.
Calendar windows include the January handover. Inherited policies, Congress, the Federal Reserve and external events also affect labor-market outcomes. These observations do not isolate a president’s causal contribution. Both charts show percentages but use different denominators and vertical scales. Participation uses a zoomed axis; scales remain fixed during replay. Shading marks inherited context. Changes are percentage points (pp), not percent changes.
Compare completed windows.
Each row compares the preceding December with December of year four. Endpoints do not summarize every month: select a window to inspect its full trajectory, including recessions and recoveries.
| President / window | Baseline → endpoint | Unemployment: start → end | Change (pp) |
|---|---|---|---|
| Dec 1976 → Dec 1980 | 7.8% → 7.2% | -0.6 pp | |
| Dec 1980 → Dec 1984 | 7.2% → 7.3% | +0.1 pp | |
| Dec 1984 → Dec 1988 | 7.3% → 5.3% | -2.0 pp | |
| Dec 1988 → Dec 1992 | 5.3% → 7.4% | +2.1 pp | |
| Dec 1992 → Dec 1996 | 7.4% → 5.4% | -2.0 pp | |
| Dec 1996 → Dec 2000 | 5.4% → 3.9% | -1.5 pp | |
| Dec 2000 → Dec 2004 | 3.9% → 5.4% | +1.5 pp | |
| Dec 2004 → Dec 2008 | 5.4% → 7.3% | +1.9 pp | |
| Dec 2008 → Dec 2012 | 7.3% → 7.9% | +0.6 pp | |
| Dec 2012 → Dec 2016 | 7.9% → 4.7% | -3.2 pp | |
| Dec 2016 → Dec 2020 | 4.7% → 6.7% | +2.0 pp | |
| Dec 2020 → Dec 2024 | 6.7% → 4.1% | -2.6 pp |
Trump II · 20 months
Dec 2024 → Aug 2026. This shorter window is not compared as a completed term.
Monthly values, definitions & comparability
BLS household survey, civilian noninstitutional population age 16+. Both series are seasonally adjusted: LNS14000000 (official U-3 unemployment rate) and LNS11300000 (labor force participation rate). Change in percentage points = selected rate − rate in the preceding December. For example, 6% to 4% is −2 percentage points.
Frozen extract retrieved October 1, 2026; latest release September 4, 2026. Seasonal revisions and updated population controls can affect comparisons. This is the published historical series, not a reconstruction under identical population controls. January 2026 incorporates revised population controls. No missing month is interpolated, and this edition does not update automatically.
Download monthly labor data & footnote codes (CSV) ↓| Month | Unemployment | Change (pp) | Participation | BLS notes |
|---|---|---|---|---|
| Jan 2023Before window | 3.5% | -0.6 pp | 62.4% | — |
| Feb 2023Before window | 3.6% | -0.5 pp | 62.5% | — |
| Mar 2023Before window | 3.5% | -0.6 pp | 62.6% | — |
| Apr 2023Before window | 3.4% | -0.7 pp | 62.6% | — |
| May 2023Before window | 3.6% | -0.5 pp | 62.6% | — |
| Jun 2023Before window | 3.6% | -0.5 pp | 62.6% | — |
| Jul 2023Before window | 3.5% | -0.6 pp | 62.6% | — |
| Aug 2023Before window | 3.7% | -0.4 pp | 62.8% | — |
| Sep 2023Before window | 3.7% | -0.4 pp | 62.7% | — |
| Oct 2023Before window | 3.9% | -0.2 pp | 62.6% | — |
| Nov 2023Before window | 3.7% | -0.4 pp | 62.8% | — |
| Dec 2023Before window | 3.8% | -0.3 pp | 62.5% | — |
| Jan 2024Before window | 3.7% | -0.4 pp | 62.5% | — |
| Feb 2024Before window | 3.9% | -0.2 pp | 62.6% | — |
| Mar 2024Before window | 3.9% | -0.2 pp | 62.7% | — |
| Apr 2024Before window | 3.9% | -0.2 pp | 62.6% | — |
| May 2024Before window | 3.9% | -0.2 pp | 62.6% | — |
| Jun 2024Before window | 4.1% | 0.0 pp | 62.6% | — |
| Jul 2024Before window | 4.2% | +0.1 pp | 62.7% | — |
| Aug 2024Before window | 4.2% | +0.1 pp | 62.7% | — |
| Sep 2024Before window | 4.1% | 0.0 pp | 62.7% | — |
| Oct 2024Before window | 4.1% | 0.0 pp | 62.5% | — |
| Nov 2024Before window | 4.2% | +0.1 pp | 62.4% | — |
| Dec 2024Baseline | 4.1% | 0.0 pp | 62.5% | — |
| Jan 2025 | 4.0% | -0.1 pp | 62.6% | — |
| Feb 2025 | 4.2% | +0.1 pp | 62.5% | — |
| Mar 2025 | 4.2% | +0.1 pp | 62.5% | — |
| Apr 2025 | 4.2% | +0.1 pp | 62.6% | — |
| May 2025 | 4.3% | +0.2 pp | 62.4% | — |
| Jun 2025 | 4.1% | 0.0 pp | 62.3% | — |
| Jul 2025 | 4.3% | +0.2 pp | 62.2% | — |
| Aug 2025 | 4.3% | +0.2 pp | 62.3% | — |
| Sep 2025 | 4.4% | +0.3 pp | 62.5% | — |
| Oct 2025 | Unavailable | Unavailable | Unavailable | 9 |
| Nov 2025 | 4.5% | +0.4 pp | 62.5% | — |
| Dec 2025 | 4.4% | +0.3 pp | 62.4% | — |
| Jan 2026 | 4.3% | +0.2 pp | 62.1% | 12 |
| Feb 2026 | 4.4% | +0.3 pp | 62.0% | — |
| Mar 2026 | 4.3% | +0.2 pp | 61.9% | — |
| Apr 2026 | 4.3% | +0.2 pp | 61.8% | — |
| May 2026 | 4.3% | +0.2 pp | 61.8% | — |
| Jun 2026 | 4.2% | +0.1 pp | 61.5% | — |
| Jul 2026 | 4.1% | 0.0 pp | 61.4% | — |
| Aug 2026 | 4.1% | 0.0 pp | 61.6% | — |
Footnote 1: population-control changes. Footnote 9: October 2025 data unavailable because of the lapse in appropriations. Footnote 12: January 2026 revised for updated population controls. Consult the linked BLS footnote register for full definitions.
Read the measure correctly.
Unemployment is the unemployed share of the labor force; participation is the labor-force share of the civilian noninstitutional population age 16+. Both rates are seasonally adjusted. Population controls, revisions and demographic change affect interpretation. October 2025 remains missing. The extract is frozen through August 2026.