
Presidential performance / Crime
Is the crime decline an all-time record?
Read the FBI’s national findings, distinguish offense counts from population rates, and compare the inherited trend with equal completed-term endpoints.
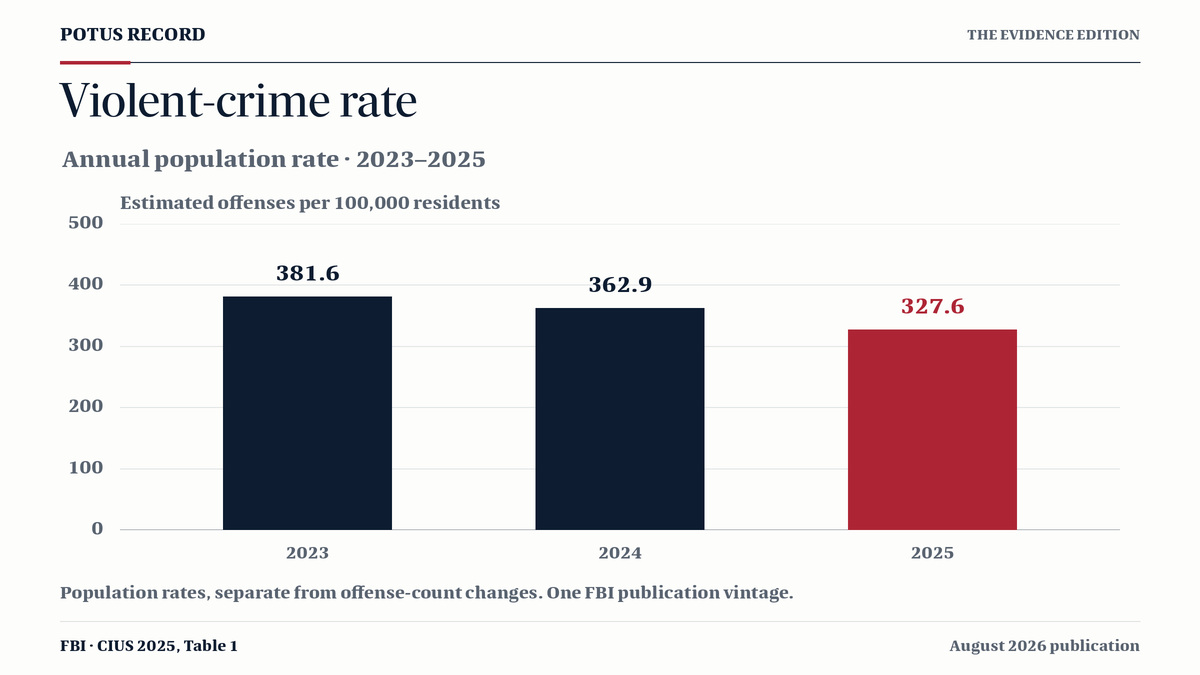
National violent-crime rates from one FBI publication vintage. Population rates and offense-count changes are separate measures.
The FBI confirms a record annual decline in the violent-crime rate.
FBI estimates show 9.3% fewer violent offenses and a 9.7% lower population rate in 2025. The FBI calls the rate decline the largest since its estimates began in 1936. This is a national statistical outcome, not proof of one president’s sole causal contribution.
| Measure | Year | Annual change | Magnitude |
|---|---|---|---|
| Violent crime | 2025 | -9.3% | |
| Murder | 2025 | -18.1% | |
| Robbery | 2025 | -18.5% | |
| Rape | 2025 | -7.6% | |
| Aggravated assault | 2025 | -7.2% | |
| Property crime | 2025 | -12.4% |
BEFORE, DURING & AFTER
Put the decline in context.
2025 versus 2024
362.9 → 327.6 per 100,000
2024 versus 2023
The FBI itself describes 2025 as the largest annual violent-crime rate decline since its estimates began in 1936. Its murder-rate estimate is 4.1 per 100,000, tied with 1955 and 1956 for the lowest. These are the agency’s historical assessments, not an overall presidential ranking.
- 2023Biden381.6 per 100,000 residents
- 2024Biden362.9 per 100,000 residents
- 2025Trump II327.6 per 100,000 residents
- 2024 vs 2023 rate change
- −4.9%
- 2025 vs 2024 rate change
- −9.7%
Changes calculated from published rounded rates. Calendar-year observations; administration labels do not establish presidential causation.
FBI CIUS 2025 · Table 1 · August 2026One fixed publication edition.
Equal completed four-year endpoints
| Administration | Before → end | Change |
|---|---|---|
| Trump I2016 → 2020 | 396.6 → 389.2 | -1.9% |
| Biden2020 → 2024 | 389.2 → 362.9 | -6.8% |
Each endpoint pair spans four years. Trump II has only 2025 in this annual edition and is shown separately. These comparisons use the revised rape definition throughout; they do not isolate presidential policy effects.
One-year observation · Trump II
2024 → 2025: -9.7% in the population rate. A one-year result is not ranked against a completed four-year window.
What can affect the result?
Federal, state, tribal and local enforcement, reporting, inherited trends and events such as the pandemic all matter. National outcomes are not attributable solely to the president.
The annual record
| Year | Rate | Yearly change |
|---|---|---|
| 2014 | 371.7 | — |
| 2015 | 382.2 | +2.8% |
| 2016 | 396.6 | +3.8% |
| 2017 | 386.5 | -2.5% |
| 2018 | 374.7 | -3.1% |
| 2019 | 368.6 | -1.6% |
| 2020 | 389.2 | +5.6% |
| 2021 | Not comparable | Not comparable |
| 2022 | 389.5 | Not comparable |
| 2023 | 381.6 | -2.0% |
| 2024 | 362.9 | -4.9% |
| 2025 | 327.6 | -9.7% |
The FBI flags its 2021 estimates as not nationally representative enough for comparison. We do not interpolate that year or calculate a 2021-based sensitivity rank. Endpoint comparisons above use independently estimated 2016, 2020 and 2024 values.
Our calculation and the source limits
Rate change = (end rate ÷ baseline rate − 1) × 100. These are POTUS RECORD’s calculations from the FBI’s published one-decimal rates; small rounding differences can occur. All observations use CIUS 2025 Table 1, including revisions to earlier years. Offense-count changes and population-rate changes remain separate.
The report also gives preliminary January–June 2026 offense trends. They are not full-year 2026 estimates and are not added to this annual comparison.
Read the measure correctly.
The table displays FBI estimates of changes in offense counts, not population rates. Different offenses are not ranked against each other. The full comparison adds population rates, inherited trends and two completed four-year endpoint windows from CIUS 2025 Table 1. The FBI flags 2021 as noncomparable; preliminary 2026 trends remain outside this annual table.