* Source-version boundary. See comparability notes.
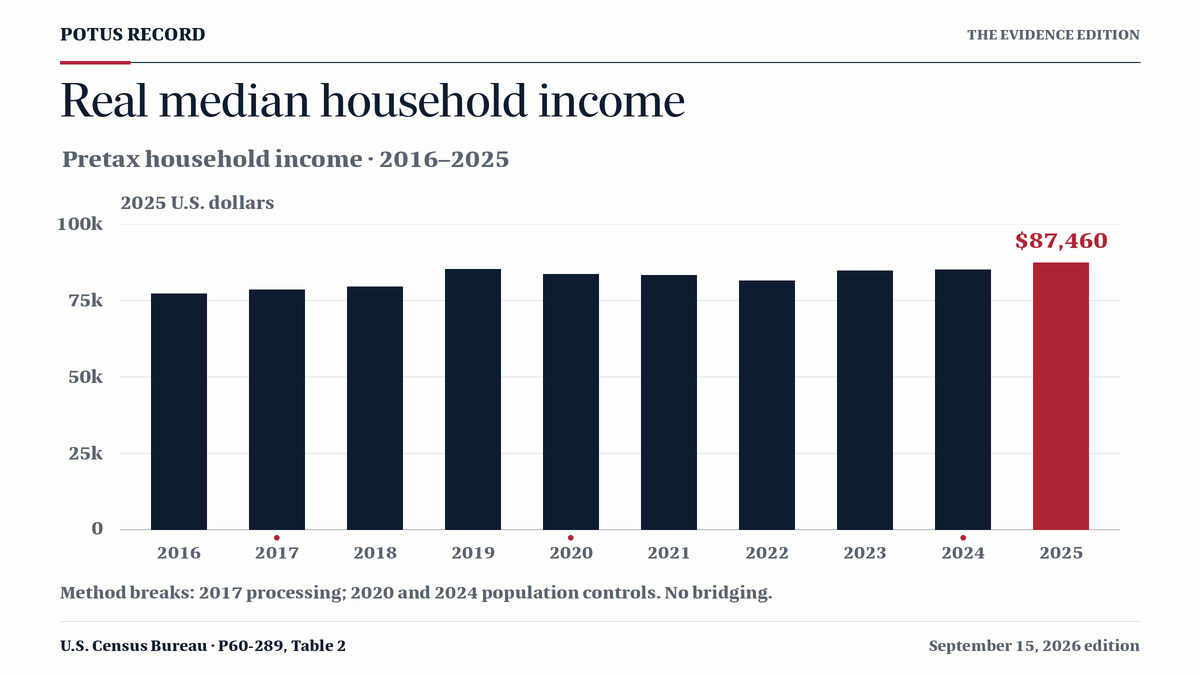
One series. Two ways to read it. The left panel shows the real dollar level; the right shows its change from a fixed baseline. These are household medians, not individual wages or the growth of the same households over time.
Same calendar windows. No causal score. Inherited conditions, Congress, household composition and other events affect income. An observed change does not isolate a president’s contribution.
Comparability notes for this window (5)
2024 estimates use Vintage 2025 population controls and differ from the previous report.
The 2020 survey, covering calendar year 2019, began a period of nonresponse bias identified by Census research. Published estimates are retained without a site adjustment.
Partial window: one calendar year is published. Compare the first-year lens across administrations before drawing a relative conclusion.
These income values are already inflation-adjusted by Census. The separate CPI comparison measures consumer prices and is not used to readjust this income series.
Equal calendar-year windows describe observed changes. Source-method changes are flagged and remain unbridged. Historical endpoint changes are not statistically tested and do not establish presidential causation.
Equal windows / Real household income
Twelve windows. The same four years.
Each preceding calendar-year baseline compared with year four. Chronological order, without a performance ranking.
Values: baseline → endpoint, in 2025 dollars. Changes are total percentages, not annualized rates. *Source-version boundaries limit comparability; estimates are not fully harmonized across survey redesigns or revisions. Numerical differences are not automatically statistically significant. Select a window to inspect its path and notes.
Trump II remains a separate, incomplete window.
2024 → 2025 · $85,210 → $87,460 · +2.6%
How to read the measure
Income in dollars. Value after inflation.
A household median, before taxes
Half of households have more income and half have less. Census adds the money income of household members aged 15 and over, including earnings and qualifying cash benefits. Income is measured before taxes; capital gains and noncash benefits are excluded. This is not take-home pay.
A consistent purchasing-power unit
Every amount uses Census’s published 2025-dollar series. Census links CPI-U-X1 for 1967–1977, R-CPI-U-RS for 1978–1999 and C-CPI-U from 2000. We do not apply the separate CPI chart’s inflation rate again.
An estimate, with limits
CPS ASEC measures annual income using a household survey. Household size, composition and the number of earners can change. Sampling uncertainty, nonresponse and historical revisions matter; the median does not describe every household’s experience.
Annual values, source versions & comparability
Census P60-289, Table 2; published September 15, 2026. Frozen edition retrieved October 1, 2026, with outcomes through 2025. Real dollar change = selected income − baseline income. Index = selected income ÷ baseline income × 100. Total percent change = index − 100. Calculations use published dollar amounts before display rounding.
The baseline is the calendar year before each window; year one and year four are alternative endpoints. Calendar years include the January handover and are not exact inauguration-to-inauguration periods. Lines connect annual observations, not estimated monthly incomes. Unpublished future outcomes are left empty.
The selected series uses the redesigned 2013 income questions and updated 2017 processing. Alternative source rows remain available in the JSON download. Revised population controls, including the current 2024 estimate, remain attached to their years. Broken lines mark source-version boundaries; a shared dollar unit does not remove changes in survey methods.
Census’s 2025 inflation adjustment includes an approximation for the unavailable October 2025 price index: the geometric mean of the September and November indexes. We retain the resulting published real-income estimates. Margins of error below are at 90% confidence; they are not margins for a change between two years. Only the report’s stated 2024→2025 significance finding is reproduced here.
Donald Trump II · annual observations with inherited context
Year
Real median
90% margin
Index
Notes
2023Before window
$84,730
±$667
99.4
—
2024Baseline
$85,210
±$1,069
100.0
2024 estimates use Vintage 2025 population controls and differ from the previous report.
2025
$87,460
±$1,040
102.6
—
Read the measure correctly.
Census P60-289 Table 2: pretax household money income, not individual wages or disposable income. All displayed levels are published 2025-dollar values. The frozen September 2026 vintage includes revised 2024 population controls and historical survey and processing qualifications.
Official sourceCensus: Income in the United States: 2025 ↗ (opens in a new tab)September 15, 2026 · retrieved October 1, 2026 · P60-289; pretax household money income. Appendix A documents the linked price indexes used for published 2025-dollar values, including Census’s official October 2025 approximation.
Official sourceCensus Table 2: historical household money income (XLSX) ↗ (opens in a new tab)P60-289 · September 2026 edition · All households, all races: published median income in 2025 dollars, margins of error and historical footnotes. Duplicate 2013 survey and 2017 processing versions are retained in the source record.
Official sourceCensus: income report and original tables ↗ (opens in a new tab)September 15, 2026 · Original publication and table links. Current-vintage 2024 median $85,210 and 2025 median $87,460: reported real increase of 2.6%, significant at the 90% confidence level.
Official sourceCensus: updated 2024 population controls ↗ (opens in a new tab)2026 working paper · retrieved October 1, 2026 · Background for revised 2024 estimates in the September 2026 publication; earlier publication values are not mixed into this edition.