An independent presidential recordReviewed October 1, 2026
POTUSRECORDThe office changes. The record remains.
Presidential performance / Investment
How much foreign investment entered the United States?
Follow the official record of inward direct investment across presidential windows, with equal calendar periods and the size of the economy in view.
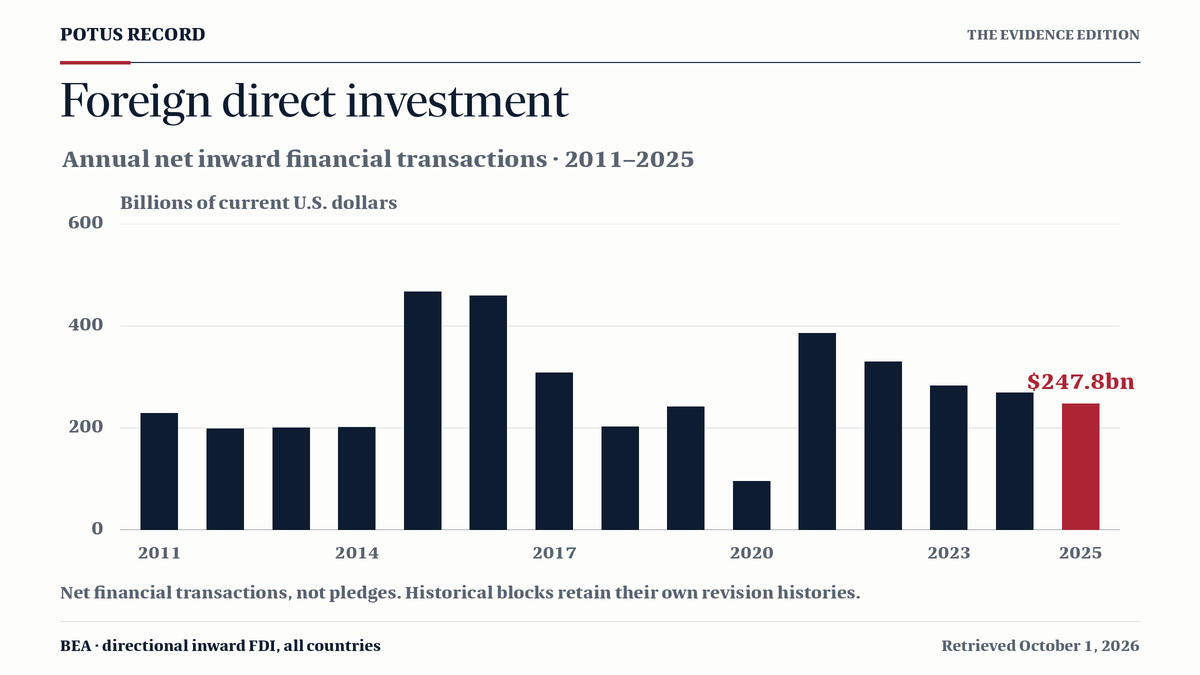
Annual net inward FDI financial transactions, without current-cost adjustment. Dollar values are nominal; historical blocks retain different revision histories.
The same annual investment flow divided by the size of the U.S. economy in that year.
0.80%2025 · share of annual nominal GDP
A common frame across decades.The GDP ratio adds economic context to dollar amounts. It is not an inflation-adjusted investment series.
Shading: preceding yearsAnnual FDI ÷ annual GDP
2025–2025 / 1 year$247.8bn
Cumulative net FDI
Same observed window$247.8bn / yr
Average annual net FDI
Sum of FDI ÷ sum of GDP0.80%
FDI share across the window
Actual transactions, not announced pledges. The series covers direct investment in U.S. businesses. It includes acquisitions and reinvested earnings; it is not limited to new factories or cash arriving from abroad. Negative values are net decreases.
Observed during a presidency. Investment decisions reflect earlier plans, market conditions and policy across administrations. These calendar windows include the January handover. The figures do not isolate a president’s contribution.
Historical comparability. Official table blocks retain different revision histories. Debt-classification changes in 1994 and 2007 also limit comparisons across those boundaries.
Equal windows / Since 1981
Same duration. A fairer comparison.
Compare the first one, two, three or four calendar years of each window. Chronological order, with incomplete windows included only when enough annual data exist.
Cumulative net FDI · nominal dollarsWindow FDI / GDP
Only the selected number of published years enters each card. Dollar amounts are not adjusted for inflation. The GDP share uses the sum of investment divided by the sum of GDP, not a simple average of annual percentages. Card bars compare cumulative amounts within this duration; they are not rankings. *A debt-classification change falls within this window; see the historical comparability note and annual data.
Origins & industries / 2025
Where investment connects to America.
A fixed 2025 snapshot of annual net investment. These panels do not change with the presidential-window selector. Selected countries do not account for the entire total.
2025 / Annual snapshot
Selected investor countries.
Country of the foreign parent, which can differ from the country of the ultimate owner.
FDI concerns a lasting ownership relationship in a business. Portfolio purchases of stocks and bonds are outside this measure. Reinvested U.S. earnings and transactions between affiliated companies can contribute to FDI without a new plant opening.
Net flows, not accumulated holdings
Annual financial transactions record increases less decreases. The sum across a window is cumulative net investment during those years, not the foreign direct investment position at the end of the window. Valuation changes also affect that position.
Commitments have their own record
A multiyear pledge, a signed agreement and an observed financial transaction describe different things. Announced packages can include purchases, lending and projects already counted elsewhere. They are not added to this statistical series or divided into it as a completion rate.
Annual data, sources & comparison method
BEA annual direct-investment financial transactions, in millions of current U.S. dollars, with annual nominal GDP in billions. Frozen official tables retrieved October 1, 2026; investment observations run through 2025. Historical table blocks retain their own revision dates and are not a uniformly revised series. No unpublished future years are estimated.
Annual GDP share = FDI in millions ÷ (GDP in billions × 1,000) × 100. Window total = sum of in-window annual FDI. Annual average = window total ÷ observed years. Window GDP share = sum of in-window FDI ÷ sum of the corresponding GDP × 100 after converting to the same units. Calculations use source values before display rounding.
Each window starts with the inauguration calendar year and runs for up to four calendar years. Up to two preceding annual observations provide context and never enter window totals. Only 1980 is available before the Reagan I window in this edition. Both charts retain the same scales when the administration changes.
Official historical table blocks retain their own revision histories; not a uniformly revised 2026 series.
Donald Trump II · annual observations, including preceding context
Year
Net FDI $ millions
Nominal GDP $ billions
FDI / GDP
Notes
2023Preceding context
283,459
27,825.886
1.02%
Official historical table blocks retain their own revision histories; not a uniformly revised 2026 series.
2024Preceding context
270,004
29,380.991
0.92%
Official historical table blocks retain their own revision histories; not a uniformly revised 2026 series.
2025Year 1
247,807
30,861.292
0.80%
Official historical table blocks retain their own revision histories; not a uniformly revised 2026 series.
Selected Trump II announcements / separate from BEA flows
The commitment. The documented next step.
These dated records describe investment plans and announced projects. They are not added to the observed-flow comparison, and they do not establish a disbursement rate.
Investment package
South Korea
$350billion
The November 13, 2025 joint fact sheet describes $150 billion for shipbuilding and $200 billion in strategic investment commitments.
Alaska LNG project announcement
A U.S. Senate release describes $54 billion for Alaska LNG as part of the existing package. It is included within the package, not an additional $54 billion on top.
The cited announcement does not establish completed funding. Separate company pledges and U.S. goods purchases are not combined with this package.
The White House’s July 23, 2025 fact sheet describes a Japanese investment commitment directed toward U.S. industries.
Further projects announced
The White House cites a first $36 billion group announced in February, followed by up to $40 billion for small modular reactors and up to $33 billion for gas generation.
Project values and “up to” amounts are announcements, not verified funds disbursed. They are not added again to the headline commitment.
Selected dated milestones, not an exhaustive country list or a complete audit of subsequent execution. The investor, time horizon and scope differ. No cross-country pledge total is calculated. BEA’s annual net flows cannot be divided by these pledges to infer completion.
Read the measure correctly.
BEA directional inward FDI financial transactions, without current-cost adjustment: equity, reinvested earnings and intercompany debt, net of withdrawals. Current-dollar amounts are not inflation-adjusted. Historical coverage changes and revision histories remain disclosed; these observations do not isolate a president’s causal contribution.
Official sourceBEA: foreign direct investment in the United States ↗ (opens in a new tab)Official annual tables retrieved October 1, 2026 · through 2025 · All-country financial transactions, directional basis, without current-cost adjustment. Historical blocks 1980–2007, 2008–2019 and 2020–2025 retain their published revision histories.
Official sourceBEA: FDI financial transactions, 1980-2007 ↗ (opens in a new tab)Retrieved October 1, 2026 · All countries; directional basis; millions of current dollars; without current-cost adjustment. Source-cell references and file hashes are preserved in the download.
Official sourceBEA: FDI financial transactions, 2008-2019 ↗ (opens in a new tab)Retrieved October 1, 2026 · All countries; directional basis; millions of current dollars; without current-cost adjustment. Source-cell references and file hashes are preserved in the download.
Official sourceBEA: FDI financial transactions, 2020-2025 ↗ (opens in a new tab)Retrieved October 1, 2026 · All countries; directional basis; millions of current dollars; without current-cost adjustment. Source-cell references and file hashes are preserved in the download.
Official sourceBEA annual current-dollar GDP, via FRED ↗ (opens in a new tab)September 30, 2026 update; retrieved October 1, 2026 · GDPA; billions of current dollars; annual, not seasonally adjusted. Distinct from the real-GDP comparison's chained-dollar series.