
Presidential performance / Debt
How did federal debt and the budget balance change?
Compare federal debt at fiscal-year end and each year’s budget surplus or deficit, in dollars and relative to the economy.
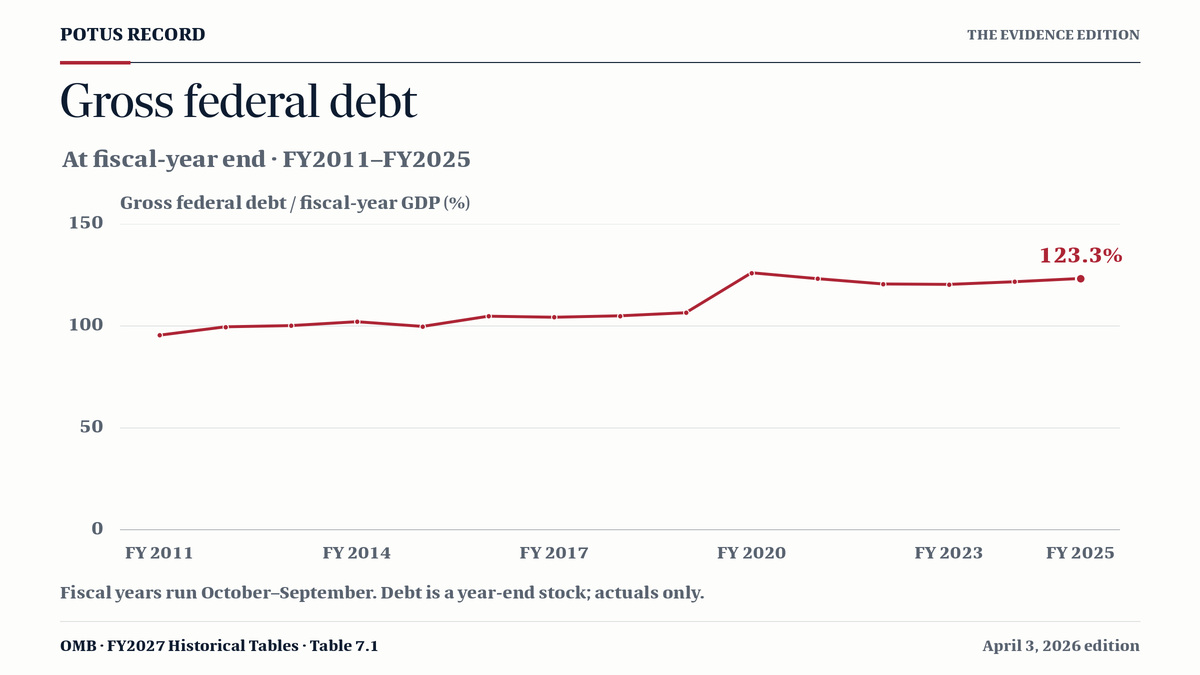
Gross federal debt at fiscal-year end, as a share of fiscal-year GDP. Actuals through FY2025; fiscal years run October–September.
Keep the debt stock and the annual budget balance separate.
Inspect equal four-fiscal-year windows with inherited conditions in view. Switch between nominal dollars and GDP ratios. A smaller annual deficit can still accompany rising debt; these observations do not isolate a president’s effects.
Donald Trump II1 completed fiscal year · incomplete four-year window
Debt baseline: Sep 30, 2024
Viewing: FY 2025 · year 1
Gross federal debt
123.3%
$37.37tn in nominal dollars
Outstanding on Sep 30, 2025 · published OMB GDP ratio
+1.6 pp · +$2.14tn since baseline
Fiscal years from baseline · dots = reported year-end stock
Annual budget deficit
−5.9%
−$1.77tn in nominal dollars
Oct 1, 2024 – Sep 30, 2025 · receipts minus outlays
Fiscal years from baseline · bars = annual flow; zero = balanced budget
Gross federal debt includes debt held by the public and government accounts, including federal trust funds. The budget balance is receipts minus outlays: negative means a deficit, positive means a surplus. A year’s deficit is not exactly its change in debt; other financing transactions also affect debt.
This is annual history, not a live 2026 debt counter. FY 2025 covers October 1, 2024–September 30, 2025. Only FY 2025 is available for the current window in this edition; later fiscal years are not estimated.
Every window’s first fiscal year begins before the January inauguration. These are fiscal-year windows, not exact presidential terms. Congress, inherited policies, the economy and other events affect both measures; this comparison does not establish exclusive presidential causality. GDP ratios follow OMB’s published series; nominal dollars are not inflation-adjusted. Each chart keeps its own fixed scale during replay; the debt axis starts at zero and the budget axis is balanced around zero.
Carter’s debt baseline is September 30, 1976, at the end of the 1976 transition quarter. The preceding FY 1975 and FY 1976 ended June 30. The three-month transition quarter is excluded from annual balance bars and four-year balance totals.
Compare completed windows.
Twelve completed windows, in chronological order. Debt is the stock at the baseline and the end of year four; its GDP change is in percentage points (pp). The budget column adds the four annual dollar balances. Annual GDP percentages are never summed. Select a row to explore the years within it.
| President / fiscal window | Debt baseline → end | Debt / GDP: start → end | Debt change (pp) | 4-year budget balance |
|---|---|---|---|---|
| FY 1977–1980 | Sep 30, 1976 → Sep 30, 1980 | 34.1% → 32.6% | −1.5 pp | −$0.23tn |
| FY 1981–1984 | Sep 30, 1980 → Sep 30, 1984 | 32.6% → 39.6% | +7.0 pp | −$0.60tn |
| FY 1985–1988 | Sep 30, 1984 → Sep 30, 1988 | 39.6% → 50.6% | +11.0 pp | −$0.74tn |
| FY 1989–1992 | Sep 30, 1988 → Sep 30, 1992 | 50.6% → 62.4% | +11.8 pp | −$0.93tn |
| FY 1993–1996 | Sep 30, 1992 → Sep 30, 1996 | 62.4% → 65.2% | +2.8 pp | −$0.73tn |
| FY 1997–2000 | Sep 30, 1996 → Sep 30, 2000 | 65.2% → 55.6% | −9.6 pp | +$0.41tn |
| FY 2001–2004 | Sep 30, 2000 → Sep 30, 2004 | 55.6% → 61.1% | +5.5 pp | −$0.82tn |
| FY 2005–2008 | Sep 30, 2004 → Sep 30, 2008 | 61.1% → 67.5% | +6.4 pp | −$1.19tn |
| FY 2009–2012 | Sep 30, 2008 → Sep 30, 2012 | 67.5% → 99.6% | +32.1 pp | −$5.08tn |
| FY 2013–2016 | Sep 30, 2012 → Sep 30, 2016 | 99.6% → 104.8% | +5.2 pp | −$2.19tn |
| FY 2017–2020 | Sep 30, 2016 → Sep 30, 2020 | 104.8% → 126.1% | +21.3 pp | −$5.52tn |
| FY 2021–2024 | Sep 30, 2020 → Sep 30, 2024 | 126.1% → 121.7% | −4.4 pp | −$7.65tn |
Trump II · 1 completed fiscal year
Debt baseline: Sep 30, 2024. Endpoint: Sep 30, 2025. This shorter window is separate from the twelve completed four-year windows.
Annual values, definitions & comparability
Federal fiscal-year observations, with amounts converted from millions to trillions of nominal dollars for display. Debt is measured at period end. Budget balance is annual receipts minus annual outlays. Debt held by the public includes the Federal Reserve and foreign holders; gross federal debt also includes government accounts. These measures describe different aspects of federal finances.
Annual data through FY 2025; dated edition 2026-10-01. Reported historical observations may be revised in later editions. No monthly interpolation or subsequent estimate is shown. The 1976 transition quarter’s debt stock is the Carter baseline; its three-month budget flow is not comparable to an annual balance. GDP ratios and debt changes use the published precision, so rounded display values may not subtract exactly.
Download annual federal fiscal data (CSV) ↓| Fiscal period | Period dates | Debt stock | Debt / GDP | Receipts | Outlays | Annual balance | Balance / GDP |
|---|---|---|---|---|---|---|---|
| FY 2023Before window | Oct 1, 2022 – Sep 30, 2023 | $32.99tn | 120.4% | $4.44tn | $6.13tn | −$1.69tn | −6.2% |
| FY 2024Debt baseline | Oct 1, 2023 – Sep 30, 2024 | $35.23tn | 121.7% | $4.92tn | $6.74tn | −$1.82tn | −6.3% |
| FY 2025 | Oct 1, 2024 – Sep 30, 2025 | $37.37tn | 123.3% | $5.24tn | $7.01tn | −$1.77tn | −5.9% |
Read the measure correctly.
OMB FY2027 Historical Tables 1.1, 1.2 and 7.1; actuals through FY2025. Federal fiscal years since 1977 run October–September, so the first year begins before the January inauguration. Nominal dollars are not inflation-adjusted. Current-term data remain separate and are not a live debt counter.