
Presidential performance / Prices
How did inflation and the price level change?
Compare inflation and consumer prices across equal completed four-year calendar windows, with the inherited trend visible and the current term shown separately.
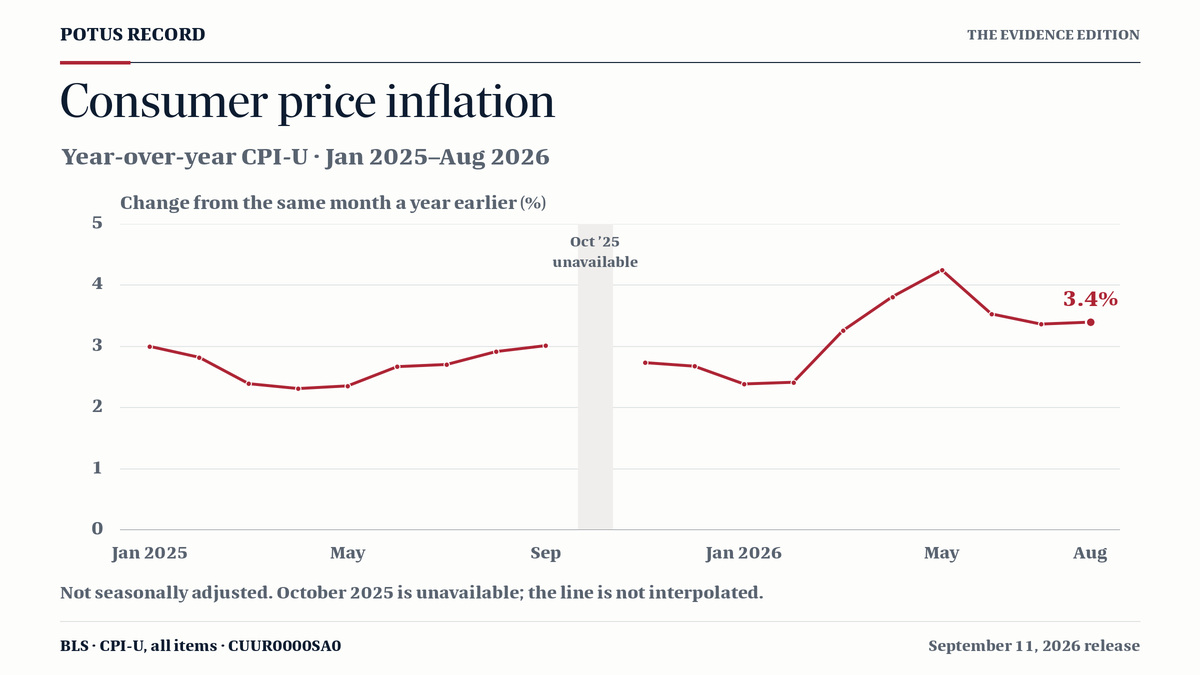
Monthly year-over-year inflation, using not-seasonally-adjusted CPI-U. October 2025 is unavailable and remains a visible gap.
Slower inflation does not necessarily mean lower prices.
Year-over-year inflation shows how quickly prices changed; the indexed price level shows their cumulative change from the previous December. Compare both measures over the same number of months. These observations do not isolate a president’s policy effects.
Donald Trump II20 months elapsed · incomplete window
Baseline: Dec 2024 = $100
Viewing: Aug 2026 · month 20
How fast are prices rising?
+3.4%
Compared with the same month one year earlier
Months from baseline · shaded area = inherited context
What does a baseline $100 become?
$106.14
+6.1% since Dec 2024 · CPI equivalent
Months from baseline · shaded area = inherited context
A lower positive annual rate means prices are still above their level a year earlier. The $100 illustration tracks the national CPI price level; it is not a household receipt or a complete cost-of-living measure.
October 2025 has no published value because of the lapse in federal appropriations. The line breaks at that month; no value is estimated. Months after Aug 2026 are beyond this edition’s data.
Calendar windows include the January handover. Inherited policies, Congress, the Federal Reserve and external events also affect prices. These observations do not isolate a president’s causal contribution. The two charts use different vertical units; scales stay fixed during replay and adjust when the selected window or context changes.
Compare completed windows.
Each row starts at $100 in the preceding December and ends four Decembers later. This is accumulated CPI change, not an annual rate or a presidential score.
| President / window | Baseline → endpoint | $100 becomes | Total change |
|---|---|---|---|
| Dec 1976 → Dec 1980 | $148.28 | +48.3% | |
| Dec 1980 → Dec 1984 | $122.02 | +22.0% | |
| Dec 1984 → Dec 1988 | $114.43 | +14.4% | |
| Dec 1988 → Dec 1992 | $117.76 | +17.8% | |
| Dec 1992 → Dec 1996 | $111.77 | +11.8% | |
| Dec 1996 → Dec 2000 | $109.71 | +9.7% | |
| Dec 2000 → Dec 2004 | $109.37 | +9.4% | |
| Dec 2004 → Dec 2008 | $110.47 | +10.5% | |
| Dec 2008 → Dec 2012 | $109.22 | +9.2% | |
| Dec 2012 → Dec 2016 | $105.15 | +5.2% | |
| Dec 2016 → Dec 2020 | $107.89 | +7.9% | |
| Dec 2020 → Dec 2024 | $121.17 | +21.2% |
Trump II · 20 months
Dec 2024 → Aug 2026. This shorter window is not compared as a completed term.
Monthly values & calculation method
Series CUUR0000SA0: CPI-U, all items, U.S. city average, not seasonally adjusted (1982–84 = 100). YoY = (CPI ÷ CPI 12 months earlier − 1) × 100. CPI equivalent = $100 × CPI ÷ the preceding December’s CPI. Calculations use the published index values before display rounding.
Source release: September 11, 2026. Extract retrieved September 30, 2026. This dated edition does not update automatically. “Unavailable” is missing data, never zero. The inherited-context values use the same December baseline.
Download the frozen monthly CPI extract (CSV) ↓| Month | CPI | Annual change | $100 equivalent |
|---|---|---|---|
| Jan 2023Before window | 299.170 | +6.4% | $94.79 |
| Feb 2023Before window | 300.840 | +6.0% | $95.32 |
| Mar 2023Before window | 301.836 | +5.0% | $95.64 |
| Apr 2023Before window | 303.363 | +4.9% | $96.12 |
| May 2023Before window | 304.127 | +4.0% | $96.36 |
| Jun 2023Before window | 305.109 | +3.0% | $96.67 |
| Jul 2023Before window | 305.691 | +3.2% | $96.86 |
| Aug 2023Before window | 307.026 | +3.7% | $97.28 |
| Sep 2023Before window | 307.789 | +3.7% | $97.52 |
| Oct 2023Before window | 307.671 | +3.2% | $97.49 |
| Nov 2023Before window | 307.051 | +3.1% | $97.29 |
| Dec 2023Before window | 306.746 | +3.4% | $97.19 |
| Jan 2024Before window | 308.417 | +3.1% | $97.72 |
| Feb 2024Before window | 310.326 | +3.2% | $98.33 |
| Mar 2024Before window | 312.332 | +3.5% | $98.96 |
| Apr 2024Before window | 313.548 | +3.4% | $99.35 |
| May 2024Before window | 314.069 | +3.3% | $99.51 |
| Jun 2024Before window | 314.175 | +3.0% | $99.55 |
| Jul 2024Before window | 314.540 | +2.9% | $99.66 |
| Aug 2024Before window | 314.796 | +2.5% | $99.74 |
| Sep 2024Before window | 315.301 | +2.4% | $99.90 |
| Oct 2024Before window | 315.664 | +2.6% | $100.02 |
| Nov 2024Before window | 315.493 | +2.7% | $99.96 |
| Dec 2024Baseline | 315.605 | +2.9% | $100.00 |
| Jan 2025 | 317.671 | +3.0% | $100.65 |
| Feb 2025 | 319.082 | +2.8% | $101.10 |
| Mar 2025 | 319.799 | +2.4% | $101.33 |
| Apr 2025 | 320.795 | +2.3% | $101.64 |
| May 2025 | 321.465 | +2.4% | $101.86 |
| Jun 2025 | 322.561 | +2.7% | $102.20 |
| Jul 2025 | 323.048 | +2.7% | $102.36 |
| Aug 2025 | 323.976 | +2.9% | $102.65 |
| Sep 2025 | 324.800 | +3.0% | $102.91 |
| Oct 2025 | Unavailable | Unavailable | Unavailable |
| Nov 2025 | 324.122 | +2.7% | $102.70 |
| Dec 2025 | 324.054 | +2.7% | $102.68 |
| Jan 2026 | 325.252 | +2.4% | $103.06 |
| Feb 2026 | 326.785 | +2.4% | $103.54 |
| Mar 2026 | 330.213 | +3.3% | $104.63 |
| Apr 2026 | 333.020 | +3.8% | $105.52 |
| May 2026 | 335.123 | +4.2% | $106.18 |
| Jun 2026 | 333.952 | +3.5% | $105.81 |
| Jul 2026 | 333.918 | +3.4% | $105.80 |
| Aug 2026 | 334.980 | +3.4% | $106.14 |
Read the measure correctly.
BLS CPI-U, all items, U.S. city average, not seasonally adjusted (CUUR0000SA0; 1982–84 = 100). The previous December is rebased to $100 for each window; this illustrates average price change, not an individual shopping bill. October 2025 remains a gap, with no interpolation. Latest release: September 11, 2026; data retrieved September 30, 2026.
See the CPI method for the baseline formulas, equal-window rules and missing-month treatment.