
Presidential performance / Economy
GDP growth by president.
What economy was inherited—and what followed?
Compare the economy before, during and after each term, using official BEA data. Rank completed four-year windows and inspect how excluding year one changes the comparison.
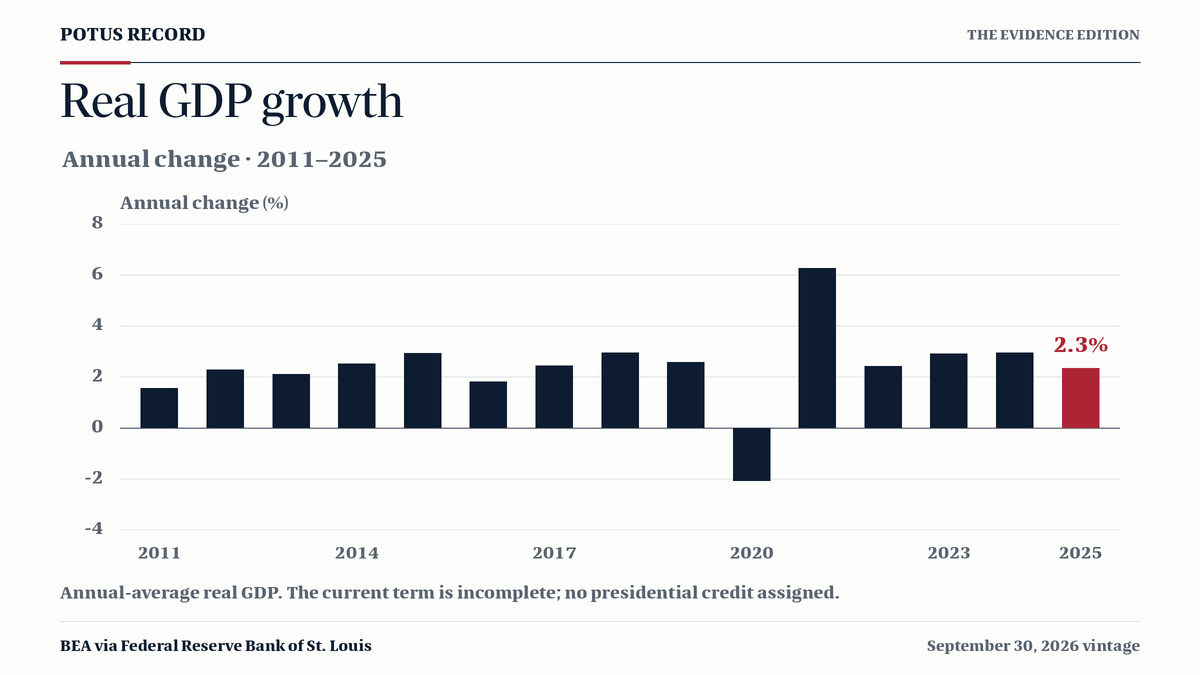
Annual change in real GDP, calculated from annual-average levels in the September 30, 2026 edition. The 2025 observation belongs to an incomplete presidential term and is not a completed-term comparison.
A first-year number cannot tell the whole economic story.
Compare complete windows with inherited conditions in view. Trump’s current term is incomplete and stays outside the completed-term ranking. The years 2–4 option tests sensitivity; it does not allocate credit between presidents.
GDP / 56-second guide
How to compare GDP growth by president
Real GDP, equal windows and inherited conditions. A quick guide to reading the comparison and its limits.
Original POTUS RECORD motion graphic with English narration and captions. Load the guide, then choose playback. Sound starts only when you play.
Read the transcript and source note
Original POTUS RECORD motion graphic with synthetic English narration. Illustrations explain the method; they do not plot GDP data. Independent publication, not a government video.
- 0:00–0:07
The question. How do you compare GDP growth by president? Start with a fair comparison.
- 0:07–0:17
The measure. Use real GDP: inflation-adjusted economic output from the Bureau of Economic Analysis, republished by FRED.
- 0:17–0:27
The window. Compare twelve completed four-year calendar windows, from nineteen seventy-seven through twenty twenty-four. Include the transition year.
- 0:27–0:37
The context. Read inherited conditions and what followed. Excluding year one tests sensitivity; it does not assign presidential credit.
- 0:37–0:46
The boundary. Trump’s second term is incomplete and stays outside completed-window comparisons. Later years are not filled with forecasts.
- 0:46–0:56
The standard. Growth is not a verdict on greatness. Follow the official source. This edition uses the September thirtieth, twenty twenty-six update.
Source: Bureau of Economic Analysis annual real GDP, republished by the Federal Reserve Bank of St. Louis. Frozen source vintage: September 30, 2026; accessed October 6, 2026. Open the official data (opens in a new tab)
BEA via FRED GDPCA · annual real GDP, billions of chained 2017 dollars. Source update: September 30, 2026; accessed October 6, 2026 (client local date).
Open the official GDP source · Download this edition · Annual values (CSV)
Growth carries across inaugurations. Read the previous two years, the full term and the following year together. These observations do not isolate a president’s policy effects.
Default: all four calendar years, including the transition year.
| Rank | Term / years measured | Annualized growth | Total change |
|---|---|---|---|
| 1 | 1997–2000 | +4.4% | +19.0% |
| 2 | 1985–1988 | +3.8% | +16.2% |
| 3 | 2021–2024 | +3.6% | +15.3% |
| 4 | 1993–1996 | +3.3% | +13.9% |
| 5 | 1977–1980 | +3.2% | +13.6% |
| 6 | 1981–1984 | +3.1% | +12.9% |
| 7 | 2013–2016 | +2.4% | +9.7% |
| 8 | 2001–2004 | +2.3% | +9.6% |
| 9 | 1989–1992 | +2.2% | +9.2% |
| 10 | 2005–2008 | +2.1% | +8.6% |
| 11 | 2017–2020 | +1.5% | +6.0% |
| 12 | 2009–2012 | +1.0% | +3.9% |
Annualized growth is the compound yearly rate between annual GDP levels. Ranks use the displayed 0.1-point precision; “=” marks a tie. Select a term to inspect its context.
2025: +2.3%. Only one annual observation is available in this edition. Excluded from completed-window ranks; 2026–2028 are not filled with forecasts.
2024 annual GDP = 100102.32025 index · available period only
| Year / context | Real GDP growth |
|---|---|
| 2023Before this term | +2.9% |
| 2024Before this term | +3.0% |
| 2025Year 1 · transition | +2.3% |
| 2026Year 2 | Not available |
| 2027Year 3 | Not available |
| 2028Year 4 | Not available |
| 2029Following year | Not available |
Before/after years provide context and are excluded from this term’s rank. A consecutive second term inherits the same president’s first-term conditions. Trump II follows Biden, not Trump I. The baseline is an annual average, not GDP on inauguration day.
The economic paths
Two terms.
One measured view.
Follow two completed terms side by side. Each line keeps its own calendar dates; both share the same measurement and scale.
Indexed real GDP
Annual-average real GDP levels, indexed to 100 in the calendar year before each term. Four completed calendar years; these are not inauguration-day GDP observations.
Same scale across all 12 terms
Swipe the chart sideways on a narrow screen. The slider brings the selected observation into view.
Move over the chart, drag the slider, or use the arrow keys. GDP uses annual observations; monthly measures keep every published month.
Donald Trump I
100.00index2016 · Prior yearJoe Biden
100.00index2020 · Prior yearWhere each path begins
Donald Trump I2016 · 19,141.672 billion chained 2017 dollars
Joe Biden2020 · 20,284.500 billion chained 2017 dollars
The annual-growth context includes two preceding years, four term years and the following year. Before/after observations do not enter term results and do not isolate presidential causation. Consecutive terms retain their inherited conditions.
The prior year is the baseline; year 1 includes the transition between administrations. CPI and unemployment retain the full monthly window when the GDP sensitivity check changes.
Read both paths and their underlying observations
| Window position | Donald Trump ICalendar date · index / source level | Joe BidenCalendar date · index / source level |
|---|---|---|
| Prior year | 2016100.0019,141.672 billion chained 2017 dollars | 2020100.0020,284.500 billion chained 2017 dollars |
| Year 1 | 2017102.4619,612.102 billion chained 2017 dollars | 2021106.2721,556.002 billion chained 2017 dollars |
| Year 2 | 2018105.5020,193.896 billion chained 2017 dollars | 2022108.8522,079.726 billion chained 2017 dollars |
| Year 3 | 2019108.2220,715.671 billion chained 2017 dollars | 2023112.0322,724.135 billion chained 2017 dollars |
| Year 4 | 2020105.9720,284.500 billion chained 2017 dollars | 2024115.3323,394.892 billion chained 2017 dollars |
Inspect annual growth before, during and after each term
Donald Trump I
| Year / context | Growth |
|---|---|
| 2015Before this term | +2.95% |
| 2016Before this term | +1.82% |
| 2017Year 1 · transition | +2.46% |
| 2018Year 2 | +2.97% |
| 2019Year 3 | +2.58% |
| 2020Year 4 | -2.08% |
| 2021Following year | +6.27% |
Joe Biden
| Year / context | Growth |
|---|---|
| 2019Before this term | +2.58% |
| 2020Before this term | -2.08% |
| 2021Year 1 · transition | +6.27% |
| 2022Year 2 | +2.43% |
| 2023Year 3 | +2.92% |
| 2024Year 4 | +2.95% |
| 2025Following year | +2.34% |
U.S. Bureau of Economic Analysis; republished by the Federal Reserve Bank of St. Louis · GDPCAGDP article edition 2026-09-30 · source updated September 30, 2026; accessed October 6, 2026 (client local date)Open the official source
GDP follows the edition selected above. Consumer prices and unemployment retain the frozen blind-record v1 inputs, with their own release dates. They are distinct measures, not a combined score. Read the comparison method
A line describes an economy during a period. It does not establish how much a president caused, or settle who was the greatest president.
The blind basic v1 and expanded v2 challenges preserve their April 9 GDP observations. Their “Term Average” is an arithmetic mean; this table shows compound annualized growth. Read the edition and calculation methods.
Read the measure correctly.
Annual-average real GDP levels, not annualized quarterly growth or Q4-to-Q4 growth. Calendar windows include the January handover. Inherited policies, Congress, the Federal Reserve and external shocks can affect later outcomes. GDP alone does not identify a president’s causal contribution. The current GDP article edition uses the September 30, 2026 source update; April 9 remains selectable for earlier links. The source edition beside the values controls which observations are shown.